Tracking the environmental health of the Tijuana River region

Healthy Water, Healthy Air Survey Results

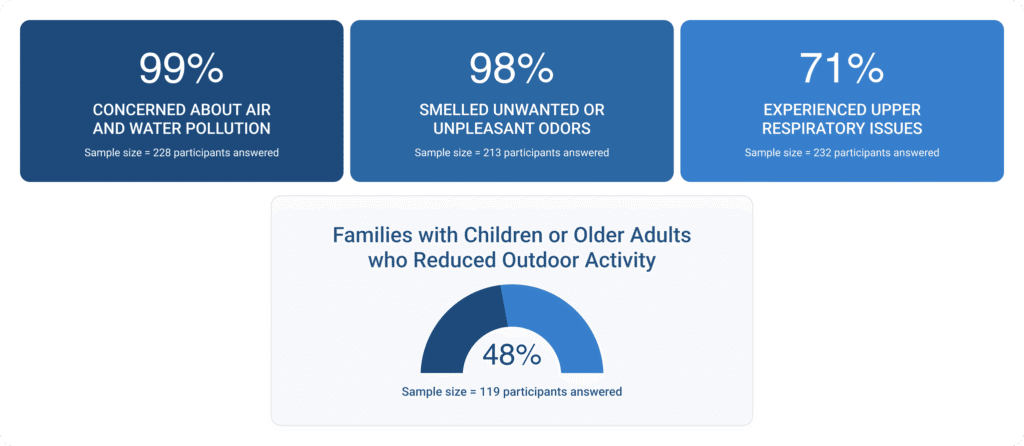
This dashboard spotlights key community health concerns to support informed, data-driven decisions.

Disclaimer: These results are from the Healthy Water, Healthy Air community survey. These findings are shared for community engagement and policy planning purposes. A peer-reviewed publication with expanded data analysis is in development.

Completed Surveys from
Sept. 2024 – June 2025 389

Community Health Challenges at a Glance
Percent of people who experienced the following upper resipiratory health issues
1%
Runny/Stuffy Nose
N=201
1%
Sore Throat
N=159
1%
Sneezing
N=164
1%
Dry Cough
N=132